The Line and the Cloud
View this presentation on a computer
This presentation uses detailed figures and interactive controls. Open it on a computer so you can see and use them properly.
Back to lectures

The Line and the Cloud
This presentation uses detailed figures and interactive controls. Open it on a computer so you can see and use them properly.
Back to lecturesHistorical background
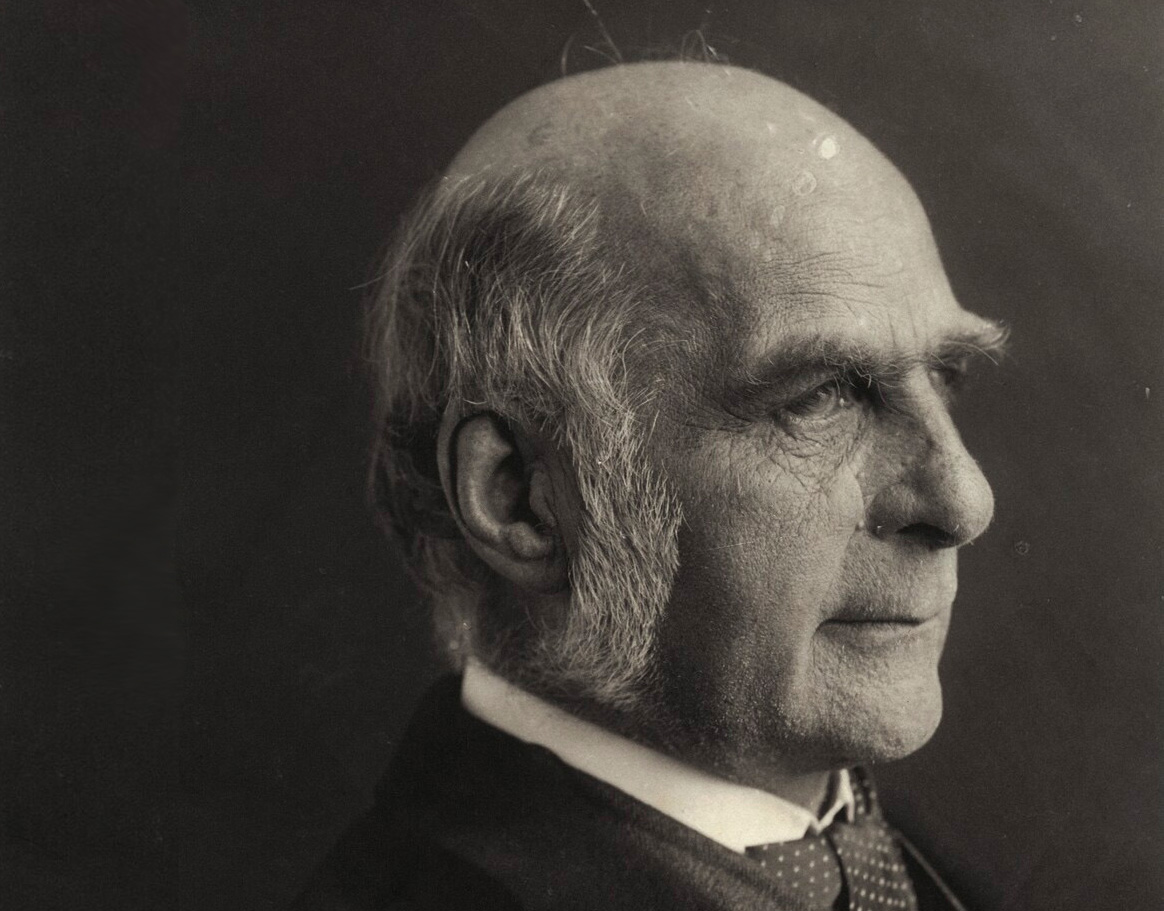
1822–1911
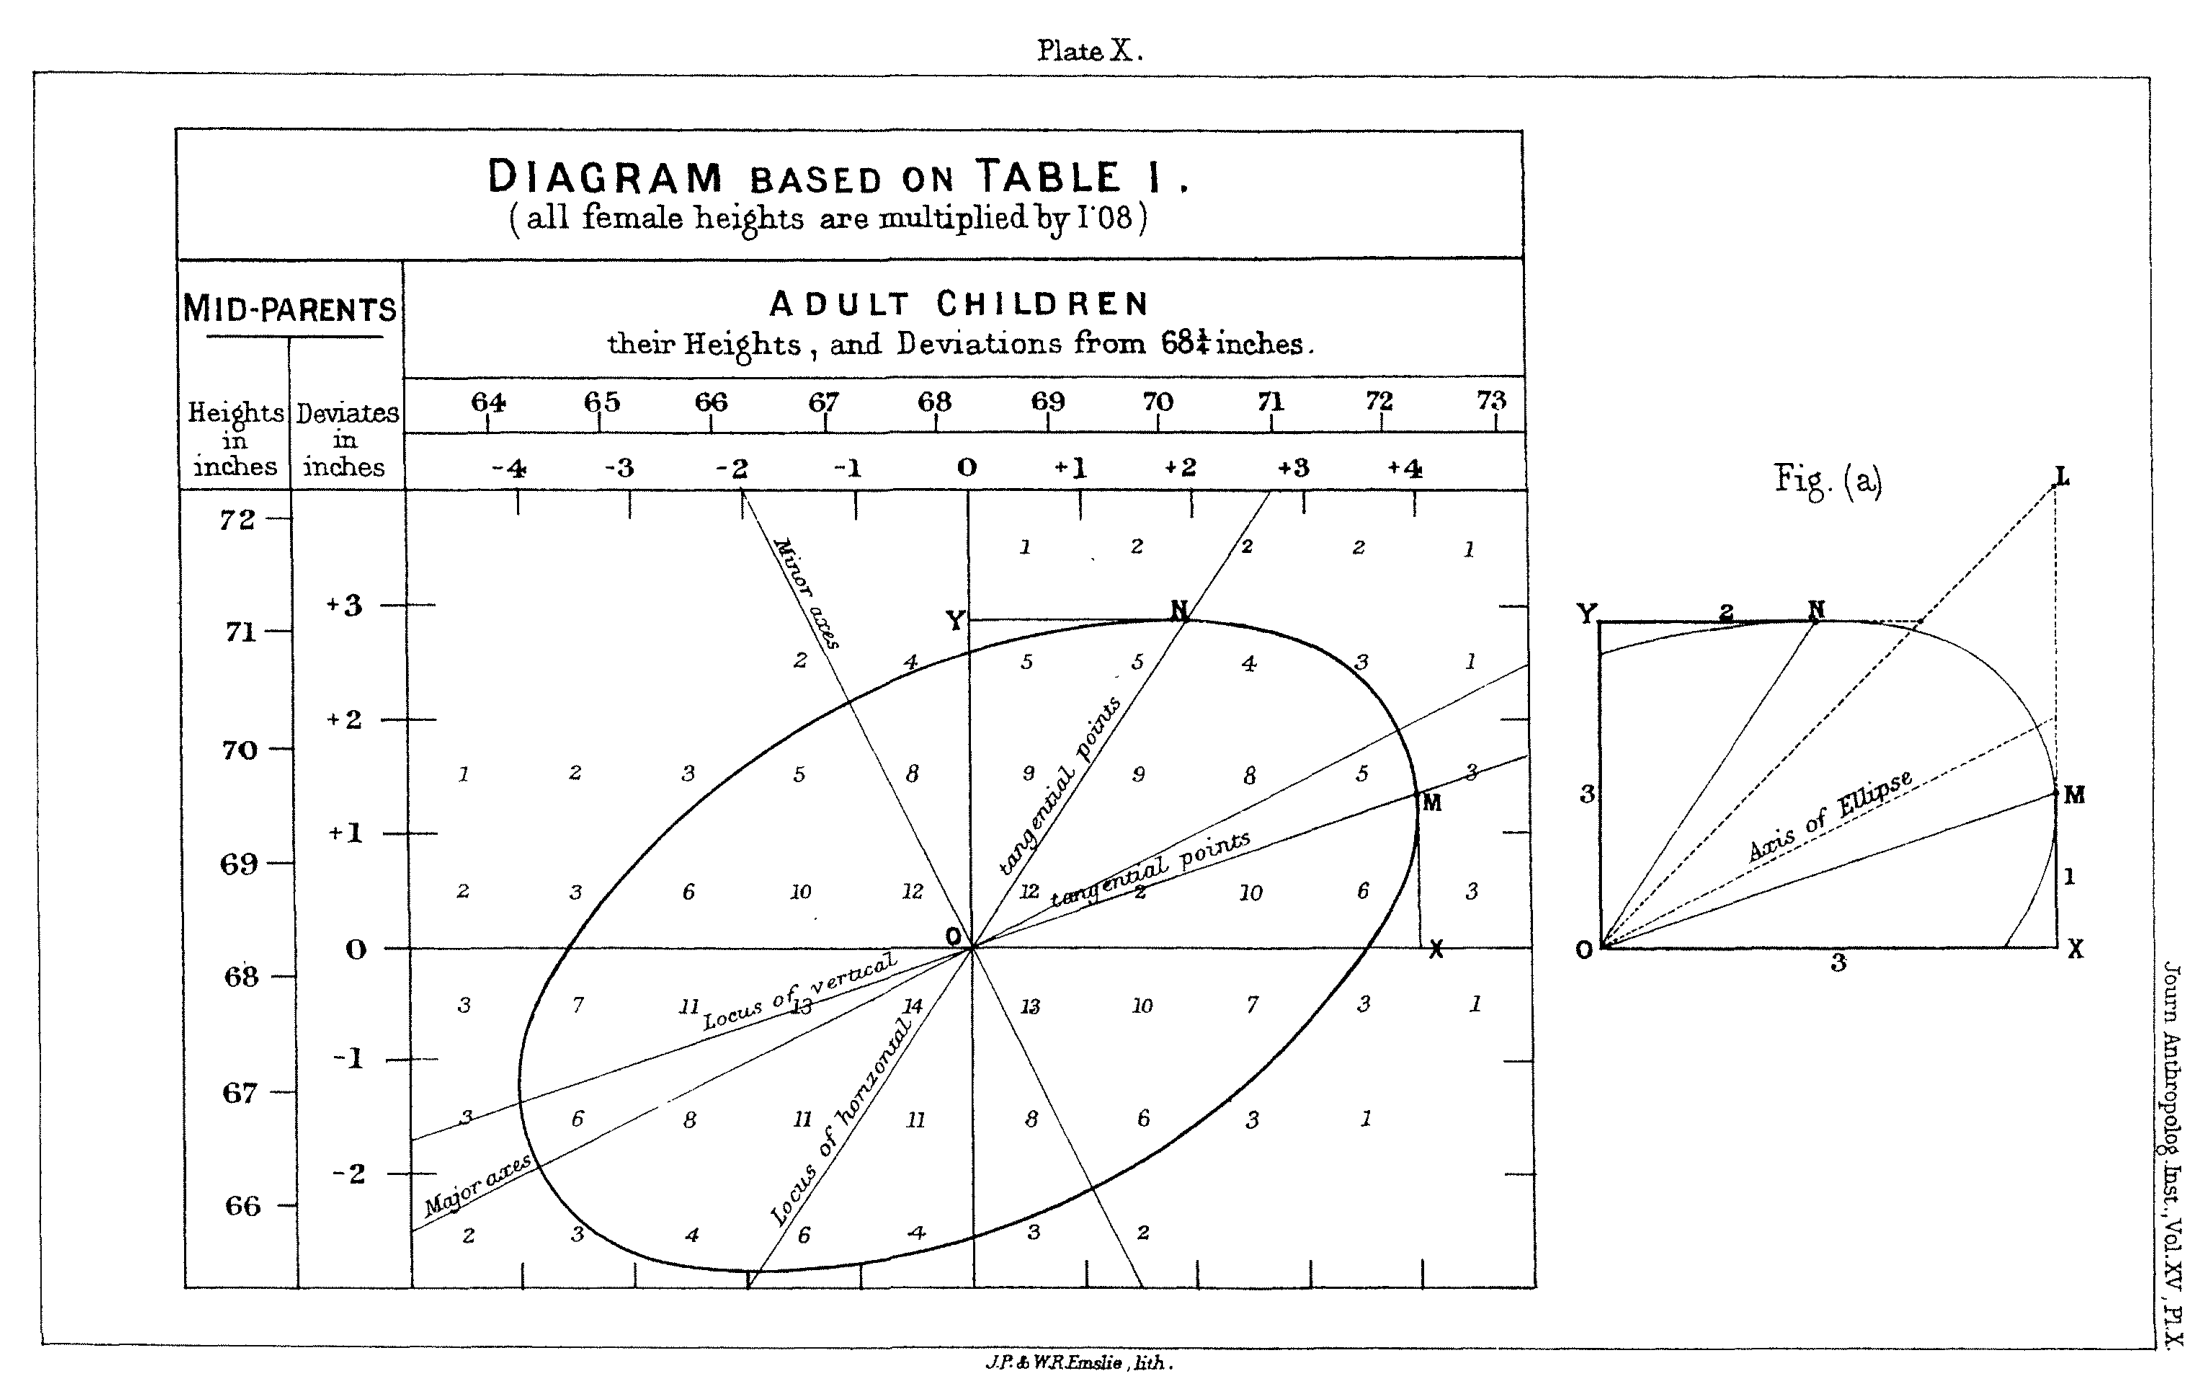
Darwin's half-cousin and a Victorian polymath with interests in heredity, meteorology and statistics. He measured parents' and children's heights, entered the frequencies in a grid and found that the contours formed ellipses.
The shape of the ellipse became his measure of association: a narrow ellipse around a line indicates a strong linear association when the axis scales are fixed. This was correlation, almost a decade before Pearson formalised r (1895–96).
Historical background
Correlation
Correlation
Agreement
Agreement
Regression models
Regression models
Regression models
Regression models
Regression models
Visual inspection
Thinking about models
The same statistical measures can describe very different point clouds.
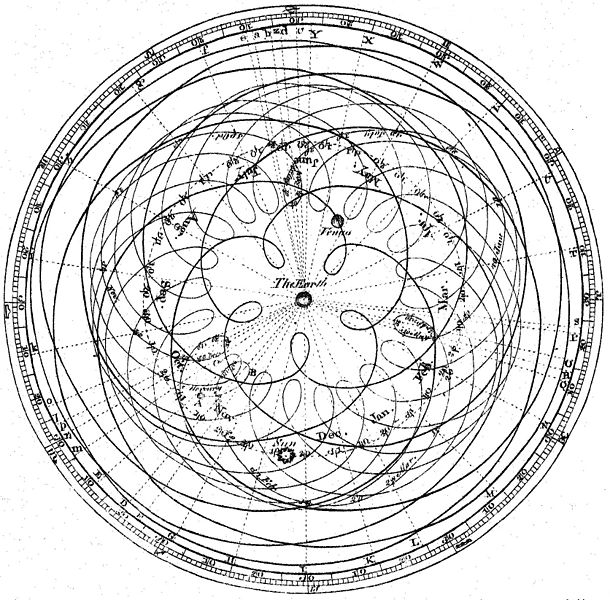
Ptolemy's epicycles predicted planetary positions with great precision. But the model put the Earth at the centre.
All regression models are geocentric, but not equally geocentric. Assumptions about the error structure determine the slope we get.
Error structure
Roughly the same absolute dispersion.
Dispersion increases with concentration.
A closer look: error structure
Models measurement error in both methods. With constant CV, it uses concentration-dependent variances.
Imprecision data determine the error model. High concentrations should not dominate simply because their absolute variance is larger.
Can stabilise proportional dispersion for positive values, but also changes the relationship being modelled.
log y = α + β log x
y = eαxβ
Uses ranked pairwise slopes and is less sensitive to isolated outliers. Does not use measured imprecision data.
When the methods are expected to give the same values, roughly equal measurement-error SDs are assumed.
Weighting
The CV is the same, but SD increases with the level.
Ten times the SD means one hundredth of the weight.
Summary
Back in the laboratory
Set the acceptance criteria before the study.
References